Overview
This was a research internship in Mohit Kumar Jolly's lab at IISc, working on a question that comes up constantly in cancer genomics but is rarely tested rigorously: if one gene's expression level predicts patient survival, do two, three, or fifty genes together predict it better — or does combining genes just add noise that looks like signal? I built a pipeline that ran Kaplan-Meier and Cox proportional hazards survival analysis across 31 cancer types from The Cancer Genome Atlas (TCGA), first gene-by-gene and then across thousands of gene combinations, and then stress-tested the whole approach against a randomized null model to see how much of what looked "statistically significant" was actually just multiple-testing noise. The short version: combinatorial signatures help in a narrow set of transcriptionally heterogeneous cancers, but most of them don't survive a train/test split, and the choice of survival endpoint (overall survival vs. progression-free interval, specifically) matters more than the size of the gene set.
Context
Gene expression profiling is one of the standard tools for finding cancer biomarkers, and the usual workflow is a single-gene Kaplan-Meier or Cox regression against a survival endpoint: split patients into high/low expression groups for one gene, see if their survival curves diverge. The problem, raised as far back as Venet et al. (2011), is that even randomly chosen gene sets can correlate significantly with survival outcomes in large enough cohorts — which raises an obvious question about whether the "prognostic" genes reported in a lot of the literature are doing anything biologically meaningful, or just riding multiple-testing noise. Biologically, this isn't surprising: genes don't act alone, they sit inside pathways and regulatory networks with redundancy and compensation built in, so a combinatorial score across several genes should, in principle, be a more faithful readout of pathway-level dysregulation than any single gene. TCGA — RNA-seq expression plus matched clinical outcomes across dozens of cancer types — is close to the ideal dataset for testing that idea at scale instead of in one cancer at a time.
Question
Do combinatorial gene-expression signatures outperform single-gene markers for survival prediction across TCGA cancer types, and if so, under which conditions — which cancers, which survival endpoints, and at what combination size does the benefit disappear into noise?
Method
Data. RNA-seq expression and clinical survival data for 31 cancer types were pulled from TCGA via the UCSC Xena Browser, using standard TCGA cancer-type abbreviations. Each patient's expression profile was matched against three survival endpoints — Overall Survival (OS), Disease-Specific Survival (DSS), and Progression-Free Interval (PFI) — each with its own time-to-event field.
Single-gene screen. For every gene in every cancer type, patients were split into high/low expression groups and run through Kaplan-Meier estimation and a Cox proportional hazards model, done separately for OS, DSS, and PFI so a gene's hazard ratio (HR) could differ by endpoint. Genes with p < 0.05 were flagged as significant, and tallied by direction of effect (HR > 1, increased risk, vs. HR < 1, protective).
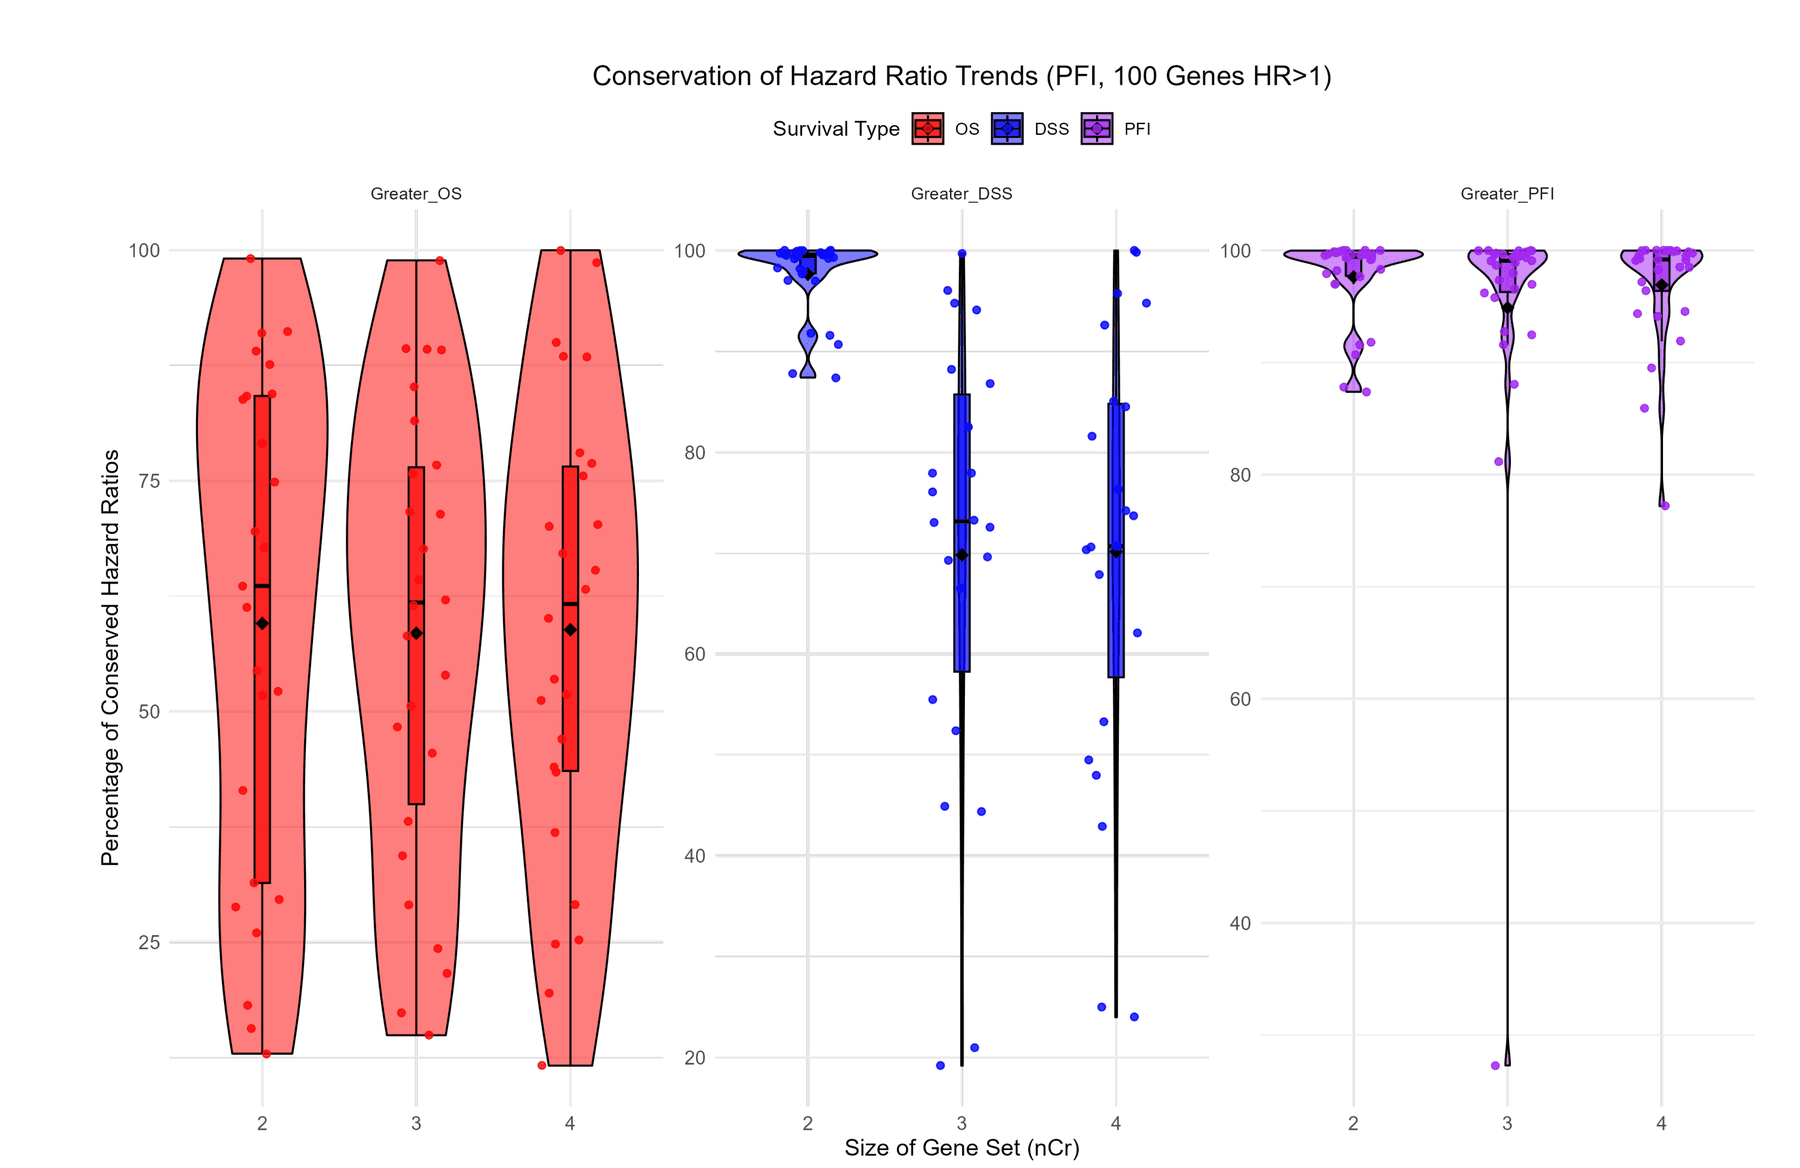
Combinatorial analysis. For each cancer type, I took the 100 genes with the most extreme (highest and lowest) hazard ratios and built combinations from them: all ¹⁰⁰C₂ two-gene pairs (4,950 combinations), a random seed-fixed sample of 4,950 three- and four-gene combinations, and a random sample of 4,950 fifty-gene combinations from the ¹⁰⁰C₅₀ space. A combination's expression value per patient was the average of its member genes' expression, then run through the same KM/Cox pipeline. For the 50-gene sets I also ran single-sample GSEA (ssGSEA) as an alternative way to score a gene set per patient, to compare against simple averaging. The key metric was conservation: for what fraction of combinations did the original single genes keep the same direction of effect (HR > 1 or HR < 1) and stay statistically significant inside the combination.
Cross-endpoint and cross-cancer correlation. Within each cancer, I log2-transformed the hazard ratios for every gene and every combination size (2, 3, 4, 50) and compared them pairwise across the three endpoints (OS vs. DSS, OS vs. PFI, DSS vs. PFI) to see whether a gene that looks prognostic for one endpoint looks prognostic for the others. Separately, for a given endpoint, I correlated hazard-ratio profiles between cancer types (Pearson R, R², p-value) to see whether biologically or anatomically related cancers show similar gene-risk patterns.
Null model / false-positive estimation. To separate real signal from artifacts of testing thousands of genes at once, I built three randomized versions of the real dataset that preserve different amounts of structure while breaking the gene-survival link: naive uniform randomization (redraw each gene's values uniformly within its real min/max, destroying within-gene correlation), permutation-based shuffling (permute each gene's values across patients, preserving that gene's distribution but breaking patient-specific association), and blockwise patient shuffling (reassign entire patients' expression profiles to different survival records, preserving the full gene-gene correlation structure but randomizing the survival mapping). Comparing the count of "significant" genes in each null dataset to the real dataset gives an estimate of the false-positive rate baked into naive p < 0.05 thresholding, and comparing real insignificant genes against null insignificant genes gives an estimate of the false-negative rate.
Literature cross-check. For each of the 31 cancers, I did a literature review (>31 papers) to compile 25–50 genes per cancer type with independent empirical evidence of being detrimental (associated with aggressive behavior or poor prognosis), and checked how many of those overlapped with the genes my pipeline independently flagged as HR > 1 and significant.
Result
Roughly 8% of genes per cancer type were significantly associated with overall survival in the single-gene screen. Hazard-ratio direction was highly conserved between single genes and combinations for the same endpoint — above 90% for identical-endpoint comparisons — but that conservation collapsed to as low as 49% when a combination's constituent genes were selected on one endpoint (e.g., PFI) and evaluated against another (e.g., OS). In other words, combination size wasn't the main driver of instability; endpoint mismatch was. Going from 2-gene to 50-gene combinations produced only modest, cancer-dependent gains — ssGSEA scoring on 50-gene sets improved accuracy by about 13% and simple-averaging by about 4% relative to 2-gene combinations for OS, with the largest improvements concentrated in transcriptionally heterogeneous cancers. Cross-endpoint correlation showed OS and DSS hazard ratios tracking each other closely across most cancers (consistent with DSS being a cancer-specific subset of all-cause OS mortality), while PFI diverged from both — a gene that predicts disease progression doesn't reliably predict death, and vice versa. Cross-cancer correlation surfaced biologically sensible pairings: KICH (kidney chromophobe) and PCPG (pheochromocytoma/paraganglioma) correlated at R > 0.84 for OS, and COAD/READ (colon/rectal adenocarcinoma) at R = 0.889 for PFI — both pairs share either mutational drivers (SDH-complex mutations for KICH/PCPG) or a signaling pathway (Wnt/β-catenin for COAD/READ). Across all cancer pairs tested, 67 pairs exceeded R > 0.70 with p < 0.05, and 678 pairs cleared p < 0.05 alone. The null-model analysis put the estimated false-positive rate at 5.07% and the false-negative rate at 2.9% — close to the nominal Type I error rate implied by a p < 0.05 threshold, but with blockwise shuffling in particular producing a wider, more volatile hazard-ratio distribution than naive randomization, meaning the specific randomization strategy used to sanity-check a result matters for how conservative that check actually is.
Reflection
The most useful outcome of this project wasn't a clean "combinations win" or "combinations lose" — it was locating exactly where the method breaks: not primarily at larger gene-set sizes, but across a mismatch in survival endpoint. That reframes the interesting question from "which genes predict survival" to "under what biological conditions does a combinatorial signal reflect real pathway coordination, versus an artifact of testing many hypotheses on a single, convenient endpoint." It also made the multiple-testing problem viscerally concrete in a way that reading about it in a stats textbook doesn't: watching a purely randomized dataset still throw off hundreds of "significant" genes at p < 0.05 is a good reminder of how easy it is to generate a plausible-looking biomarker story from noise alone if you don't build in a null-model check from the start.